-
Smart Charts
SMART CHARTS
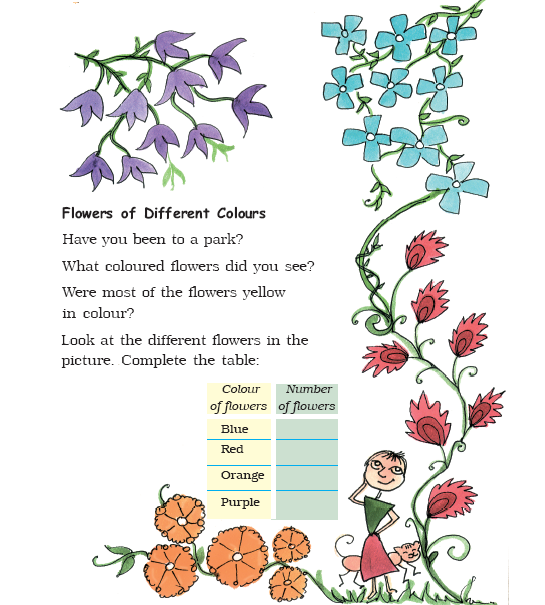
Draw the right flower. Write how many there are.
-
-------------- are the most in number. How many?-------------------- .
-
-------------------- are the least in number. How many?------------------ .
- ------------------- are more than--------------------
-
-------------------- are more than--------------
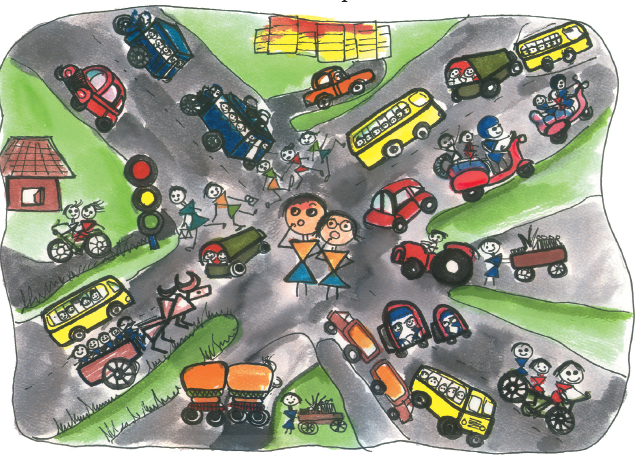
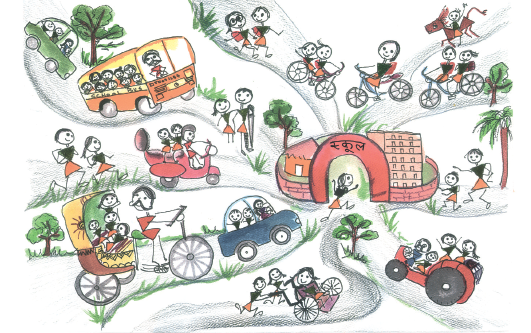
What do We See on the Road?
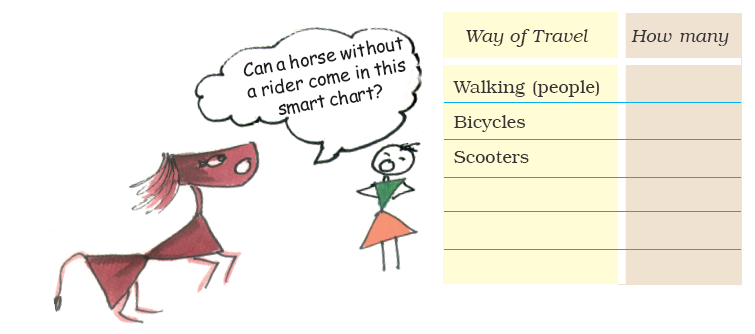
Look at the traffic scene in the picture and fill in the table
This chapter is an early introduction to data handling, an important area of mathematics. By the end of primary school, children need to be able to collect and record data, to present it in the form of bar charts and tables, to recognise patterns in the data and to draw inferences.Teachers can take several interesting and even funny examples from chilldren's own experiences. Pictures given here could also be used for different classification exercises, such as the number of petals of flowers.
Answer the following questions.
-
In the picture which way of travel do you see the most?--------------
-
Which way of travel (vehicle) do you see the least?---------------
-
The number of people walking is more than the number of-----------------
-
The number of buses is less than the number of---------------
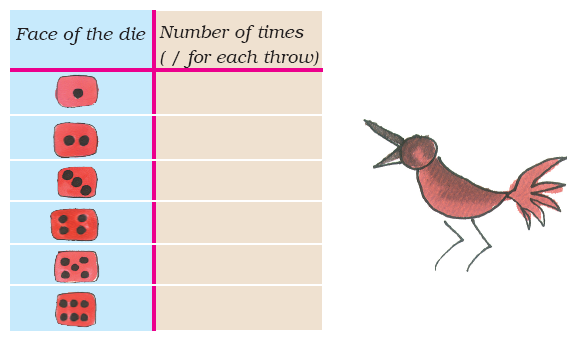
How Many Times do You Get 6?
Have you played any games with dice?
How many dots are there on the different faces of a die?
-
Throw a die.
-
Look at the number of dots you get on the face of your die.
-
For each throw draw a mark / in front of that number in the table.
-
Throw the die 30 times and mark in the table each time.
For example, Rabia threw her die 30 times. She got
 five times. In her table she marked:
Now fill in the table:
-
Which face of the die did you get the most number of times?-----------
-
How many times did
 come up?-------------- times
 -
 came up more number of times than
 -
Compare your table with that of the student sitting next to you. Do you find any difference in the two tables?
Find out from People Around You
Fill in the table:
-
Talk to people around you about their favourite sweets.
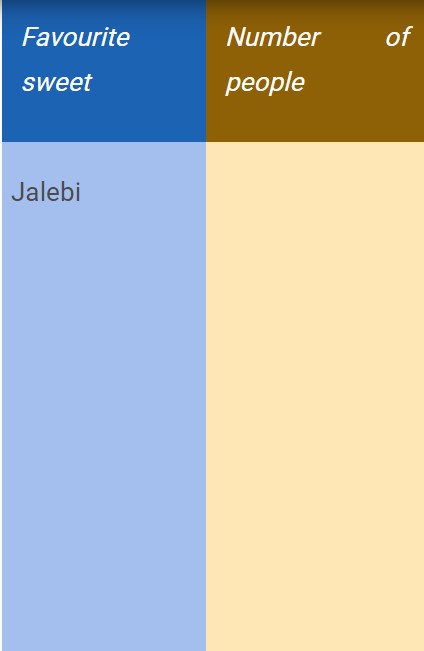
From the above table answer the following:
- Most favourite sweet------------------------
-
Least favourite sweet------------------------
-
------------------------ is liked more than------------------------
(Name of the sweet) (Name of the sweet)
-
------------------------ is liked more than------------------------
-
------------------------ is liked more than------------------------
-
------------------------ is liked more than------------------------
 2. Ask your friends about the number of people living in their homes. Fill in the table.
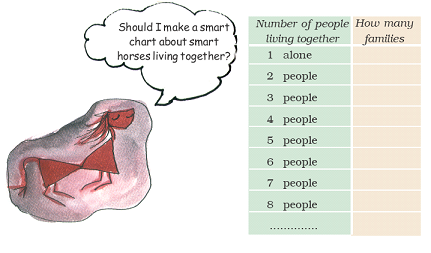
-
Most families have------------- people living in their homes.
-
The smallest number of people living in a home is-------------
-
The number of families having 4 people is--------------
 3. What have your classmates brought for lunch today? Find out and note down.
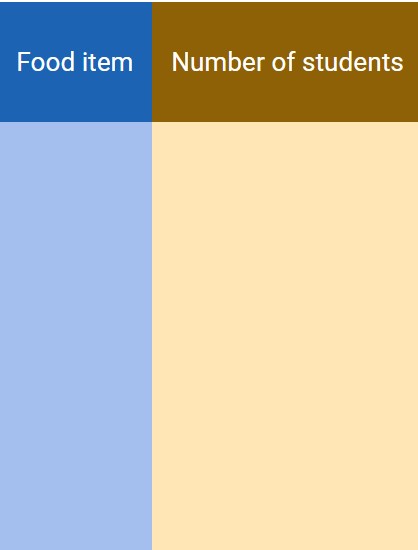
-
Food item brought for lunch by the biggest number of students-------------------
-
Food item brought by the smallest number of students----------------
Getting Smart with Charts
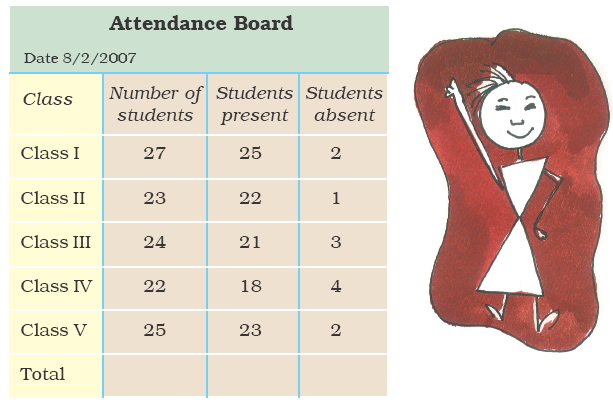
This board shows the number of students in each class. It also shows the number of students present and absent.
-
How many children in all are there in the school?
-
How many children in all are absent on that day?
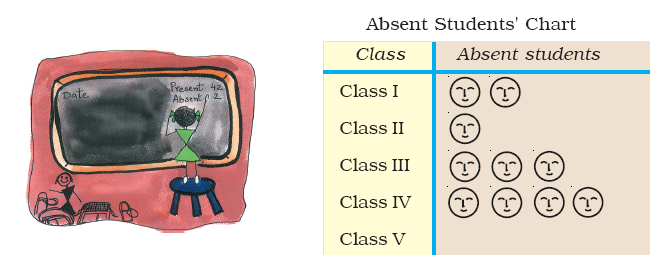
This is a chart to show the number of absent students. Each absent student is shown by
 .
.-
In the chart show the absent students of Class V.
Now look at the chart and fill in the blanks:
-
The class with the highest number of absent students is
-
The class with the least number of absent students is
-
The class with 3 students absent is
-
The number of students absent in Class IV and Class V are and
How Long is Your Hand?
-
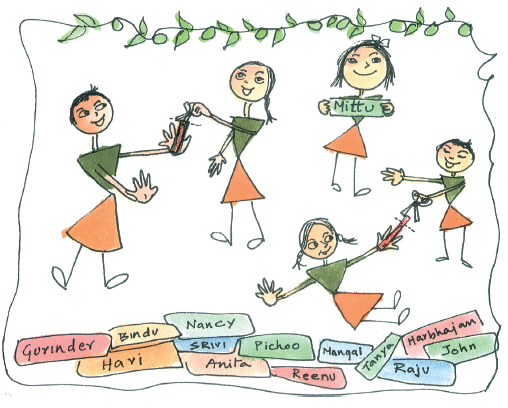
Make a group of 4 friends.
-
Cut strips from waste paper. The strips should be of the same width.
-
Measure the length of each student's hand with the paper strip. Cut the strip and write the name of the student.
Rohan, Jacob and Geeta also measured their hands. They stuck their strips as shown.
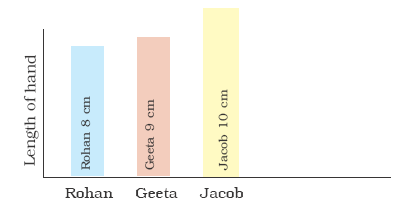
Look at the picture and fill in the blanks:
-
The length of Jacob's hand is(more/less) than Geeta's hand.
-
The length of Geeta's hand is (more/less) than Rohan's hand.
-
has the longest hand.
-
has the shortest hand.
In the chart below stick the strips of all the friends in your group. Keep some space between the strips.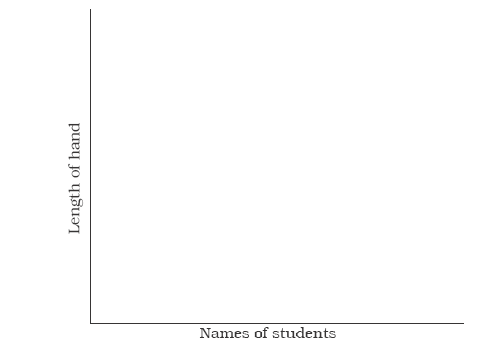
Children coming to School
Look at the picture and fill in the table.
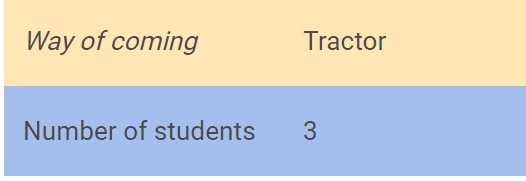
3 students are coming by a tractor. We write 3 in the table. We also draw 3 faces on top of 'tractor' in the chart. Draw faces in the chart to show how many children come by bus, bicycle, etc.

Fill in the blanks:
-
The most students come to school by----------------- .
-
The number of students walking to school is----------------- (more/less) than the students coming on bicycle.
-
The least students come to school by ---------------------.
So, isn't this a smart chart! By simply looking at it we can know so much. Let us make more such charts.
PRACTICE TIME
Make your own smart charts about things around you.
Like-
-
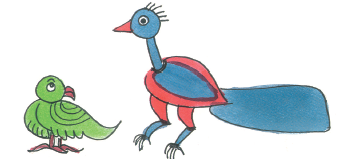
Which bird has the most colours?
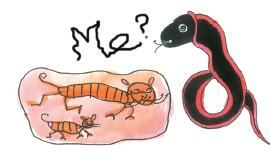
- Which is the animal which is liked most as a pet?
A Vegetable You do not Like!
Which vegetable is most disliked? Ask your friends and complete the table.
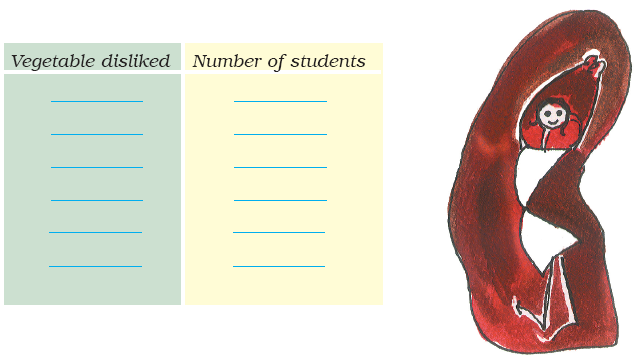
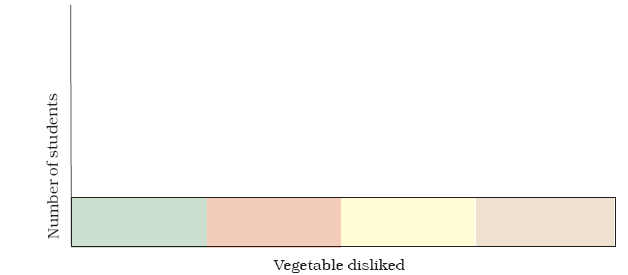
Use this table to draw faces in the chart below. Draw
 for each child on top of the vegetable disliked.
-
The most disliked vegetable is ---------------
-
The vegetable disliked by very few children is ----------------
-